Monitoring Cluster
Monitoring Cluster is a managed infrastructure of AppViewX SaaS which caters to monitoring, and understanding the performance of the application and machine critical services which is a condensed form of metadata, metrics, and events about the application and its underlying services. This is enabled with a monitoring stack comprising Prometheus, Grafana, Loki, Promtail, and AlertManager.
The monitoring cluster has a Status dashboard and is deployed in a separate cluster which is again a subset of AppViewX powered with AppViewX monitoring capability enabled via Prometheus, Grafana, Loki, Promtail, and AlertManager and it is deployed on AWS (like an onprem AppViewX deployment) with its own database, compute etc which can be deployed cross zone or cross region for high availability.
The status dashboard application will have three microservices
-
Status dashboard Webapp
-
Status Metrics Reader
-
Status Metrics Persistor
The Webapp talks to Status metrics Reader and displays AppViewX services uptime details.
The Status Metrics Reader reads data from a dedicated instance residing in MongoDB Atlas.
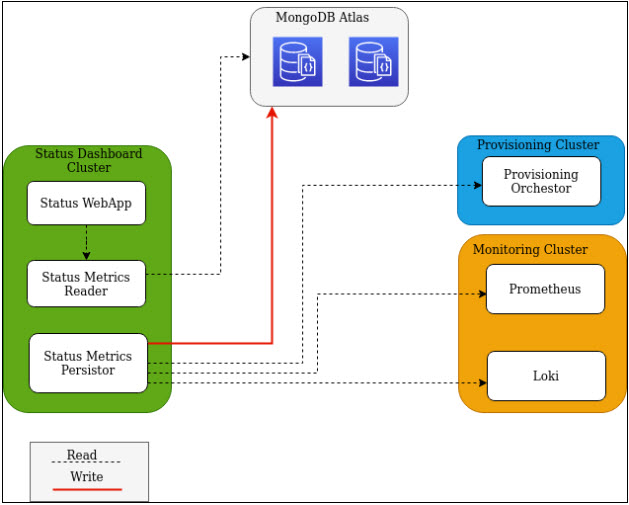
Monitoring Cluster Architecture