Default Dashboard
Users can get access to a pre-built Insights dashboard to monitor key application services KPI’s/metrics.
Displays the pre-defined widgets to provide the usage reports and up-to-the-minute reports containing statuses and statistics for devices and certificates managed within the AppViewX platform.
The purpose of the key widgets is to:
-
Monitor Device and Application health
-
Monitor Top Applications Serving Maximum Traffic
-
Monitor Unused Objects to Optimize LB Config
-
Monitor App-centric Reports
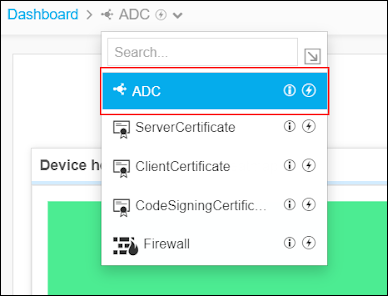
AppViewX ships default dashboard called ADC available in dashboard inventory for monitoring the load balancing application managed in AppViewX.
This default dashboard is the landing dashboard screen by default. You can
change the landing dashboard screen by clicking the icon beside its name.
Monitor Device and Application health on a Pre-Built Dashboard. Get better insights into the Device and Application health based on the statistical data configured for a specific interval.
To view the reports related to ADC, go to Menu > ADC+ > TRAFFIC MANAGEMENT > Dashboards. A pre-built ADC Dashboard appears by default.
The following reports are segregated and displayed as widgets on the ADC screen:
-
Monitor Device and Application health
-
Monitor Top Applications Serving Maximum Traffic
-
Monitor Unused Objects to Optimize LB Config
-
Monitor App-centric Reports