Microsoft DNS Audits
This dashboard displays a comprehensive view of Microsoft DNS landscape, including
traffic statistics.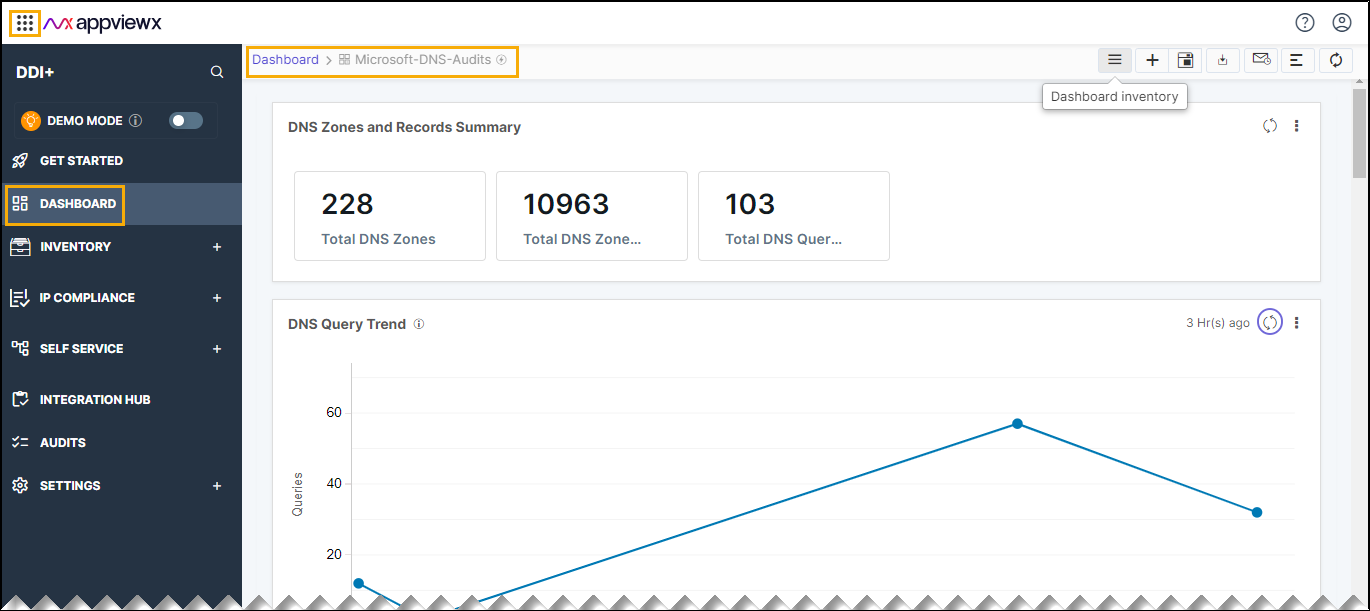
The following reports are available under the Microsoft DNS_Audits tab:
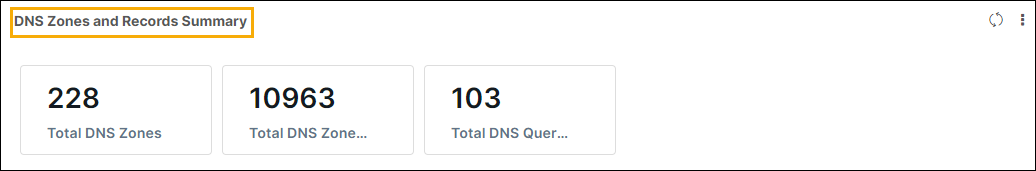
- DNS Zones and Records Summary: This metric displays the DNS Zones and
Records Summary.
- Total DNS Zones: This metric represent the total number of DNS Zones present across the Microsoft DNS servers managed in DDI+ platform.
- Total DNS Records: This metric represent the total number of DNS records present across the Microsoft DNS servers managed in DDI+ platform.
- Total DNS Queries: This metric represents the total number of DNS
queries made on the Microsoft DNS servers managed in DDI+
platform.
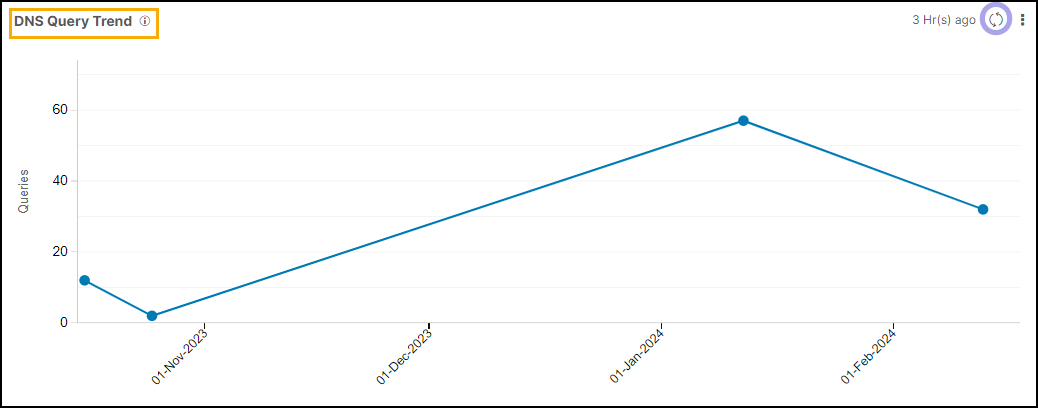
- DNS Query Trend: This report represents the daily DNS query trends.
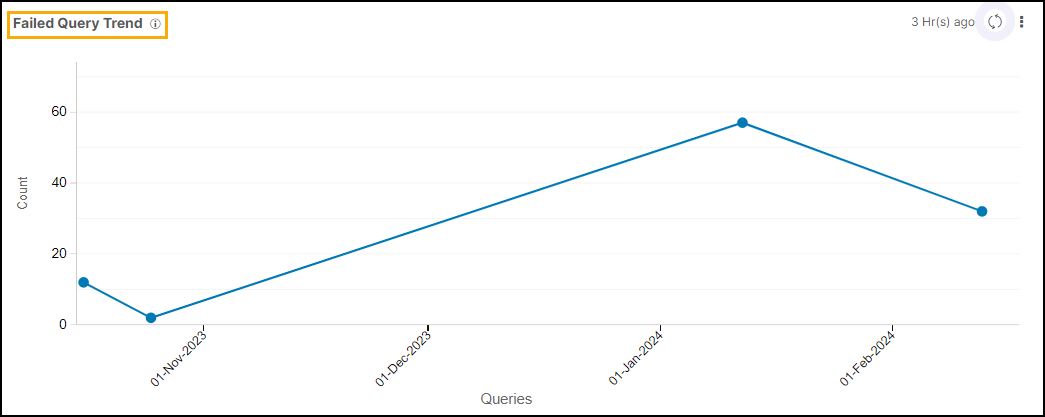
- Failed Query Trend: This reports represents the daily DNS failed query
trends.
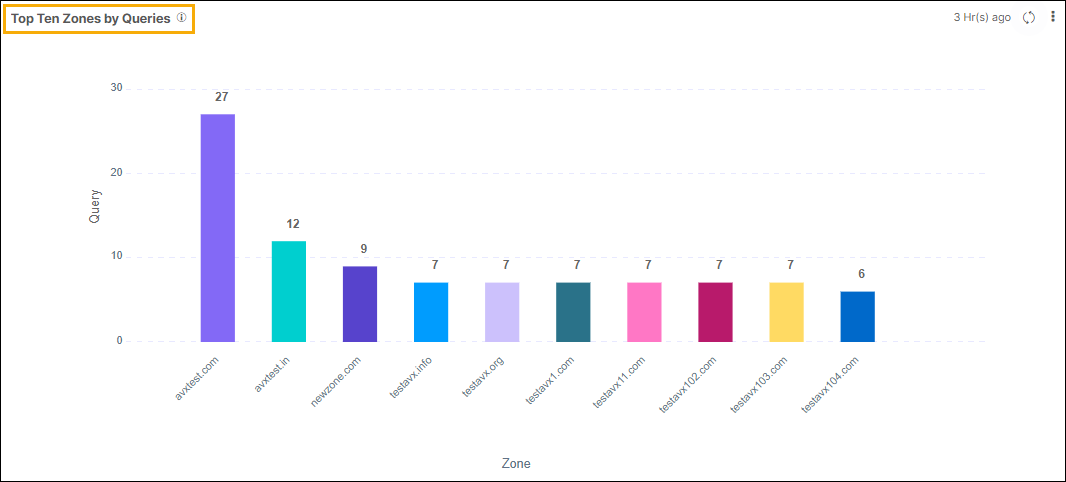
- Top Ten Zones by Queries: This bar chart illustrates the DNS Zones with
the highest number of queries. The X-axis corresponds to the Zone names, while
the Y-axis indicates the number of queries.
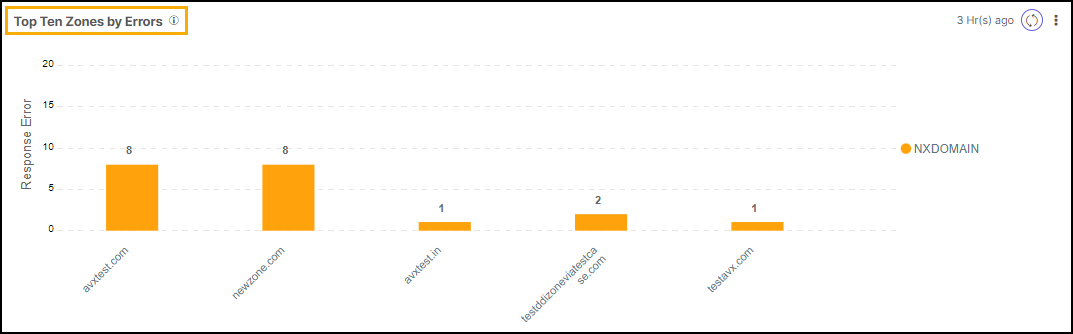
- Top Ten Zones by Errors: This bar chart depicts the top 10 DNS Zones with
the highest number of query failures. The X-axis represents Zone names, and the
Y-axis represents the number of failed queries.
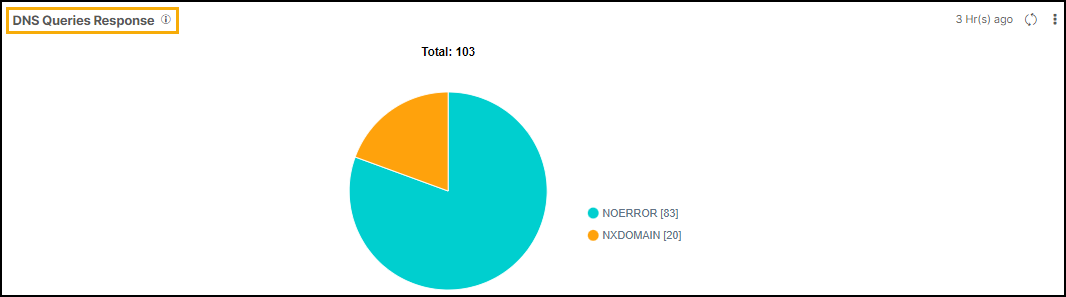
- DNS Queries Response: This Pie chart represents total DNS queries
response by error code type. such as NXDomain, SERVFAIL, and so on.
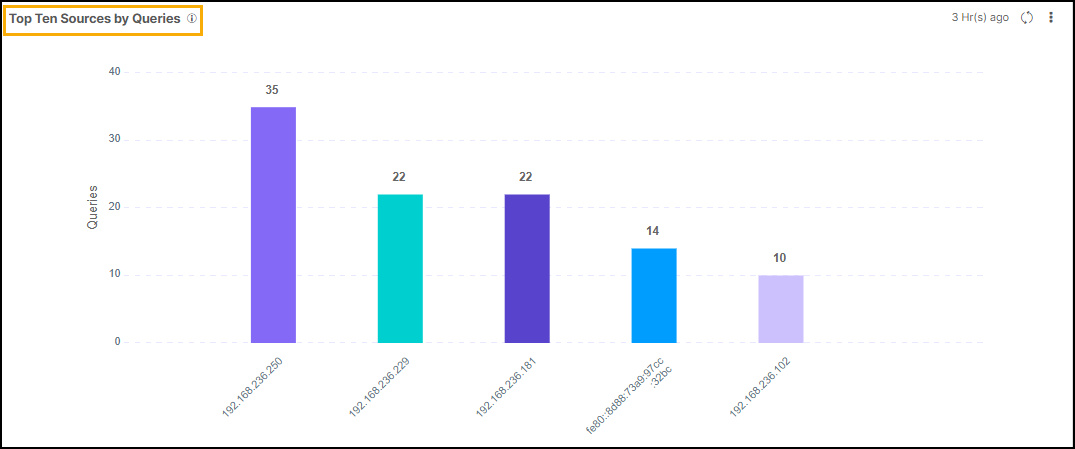
- Top 10 Sources by Queries: This bar chart illustrates the sources with
the highest number of queries. The X-axis denotes the sources, while the Y-axis
represents the corresponding number of queries made.
Note: You can click on the corresponding metric to view the
detailed information.