Getting Started with Dashboard
The DDI+ module dashboard provides a comprehensive summary of metrics including Domain
Audits, IP Compliance, DNS Zone Traffic Reports, F5 DNS Security Reports, Microsoft DNS
Audits, and Domain Vulnerability Insights. You can access the features under
DASHBOARD from the left menu.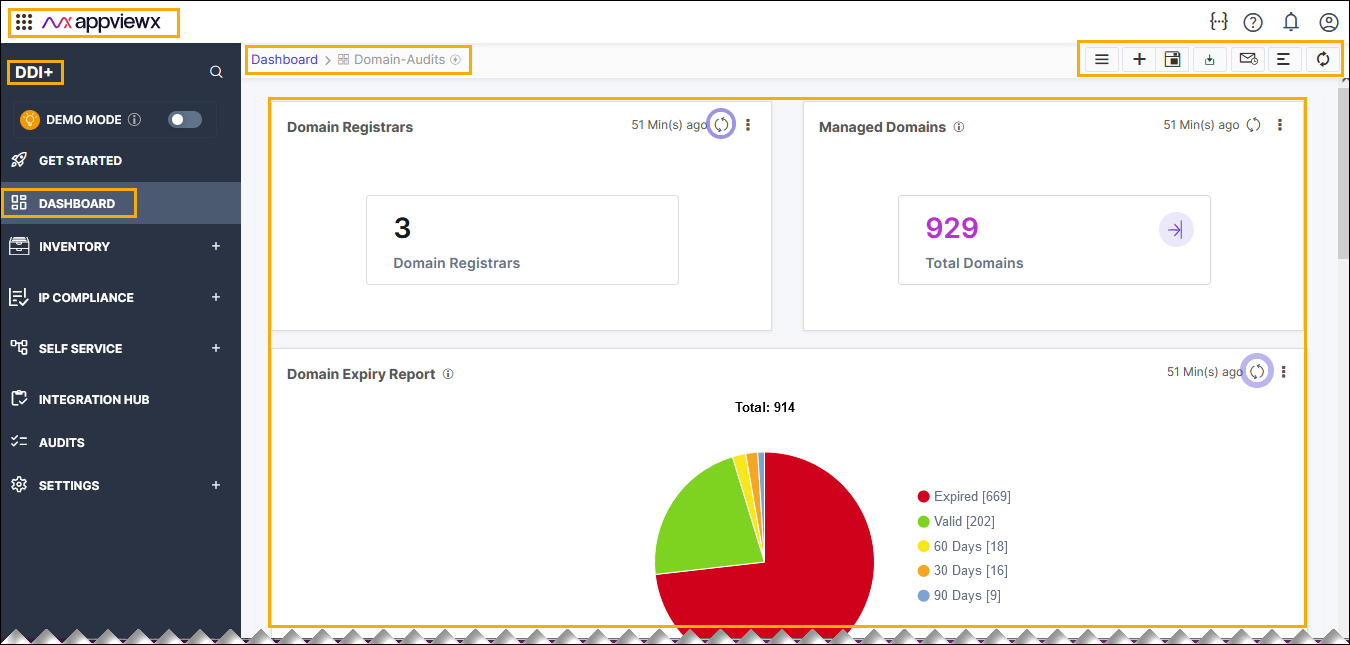
- Dashboards - Dashboard display reports and widgets that provides consolidated
statistics of all data from the respective inventories and recording the key value
indicators. The following table describes the options available on this
dashboard:
Options Description Dashboard name Displays the name of the current dashboard. 
Allows you to navigate to the Dashboard inventory. 
Allows you to create a dashboard/widget. 
Allows you to save the dashboard. 
Allows to download the dashboard details in the <.pdf> format. 
Allows you to align the widgets on the dashboard. 
Refreshes the dashboard. - Custom dashboards - These dashboards display reports and widgets created and pinned by the user. Widgets and reports on these dashboards can be added, removed, or modified as necessary and can also be shared among multiple roles. These dashboards can also be downloaded to your laptop.
Accessing the Dashboard
To access the dashboard:
- Go to Menu > DDI+ >
DASHBOARD.
The dashboard home page appears.
- Move your cursor to the breadcrumbs field of the current dashboard.
- Click the current dashboard name.
- In the dropdown list that appears, click the name of the dashboard you want to
view.
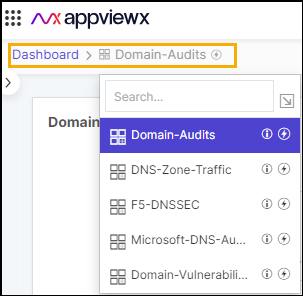 Note: You can also click the (Dashboard inventory) button in the
Command Bar and click the name of the dashboard you want to switch
to.
Note: You can also click the (Dashboard inventory) button in the
Command Bar and click the name of the dashboard you want to switch
to.