Viewing Syslog Alerts
-
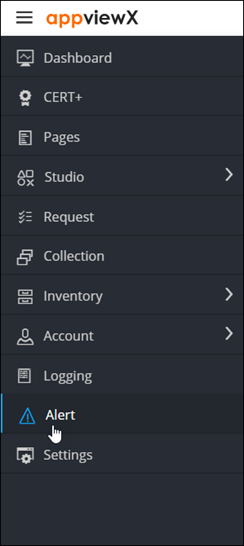
To access the navigation pane, in the top-left corner of the screen, hover the
mouse pointer over the
 icon.
icon.
-
From the menu displayed, click Alert.
The Alert :: All page is displayed (by default). -
On the Alert :: All page, click the Syslog tab.
The Alert :: Syslog page is displayed.
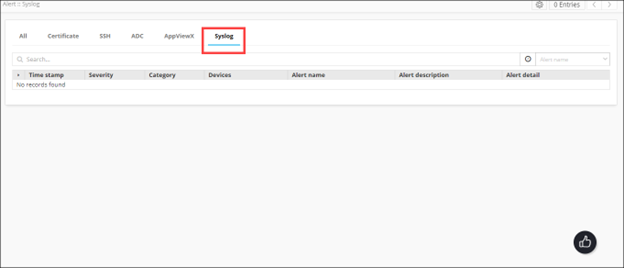
For the Syslog alerts, the page displays the following details:Field Description Timestamp Date and time at which the event, which triggered the alert, occurred. ID Alert ID Event type Type of the event that triggered the alert. Severity Alert severity.
AppViewX identifies the following severity levels (as described above):
- Critical
- Fatal
- Major
- Minor
Category Alert category. Devices Name of the device, if the alert is to notify of a device-related activity. Applications Application that triggered the alert. Purpose/Usage Purpose of the alert. Alert detail Description of the alert.