Create a Dashboard
The custom dashboard allows you to manage, monitor, and interpret all the configured applications and their objects. It provides customizable widgets to get an overview of all the ADC Applications within the AppViewX platform and manage/monitor traffic from a single screen. Customize your Application dashboard with predefined and custom widgets as per the business need. You can create dashboard using any of the following method:
To create a dashboard:
- Go to Menu > ADC+ > TRAFFIC MANAGEMENT > Dashboards.
-
If this is the first dashboard you are creating in the system, click
the Create Dashboard button that appears in the center of
the screen. If you have already created at least one dashboard, click
 (Create) icon on the top-right or click
(Create) icon.
(Create) icon on the top-right or click
(Create) icon.
-
On the Create dashboard / widget pop-up
window, enter a name for the new dashboard.
The name must not contain spaces in it.
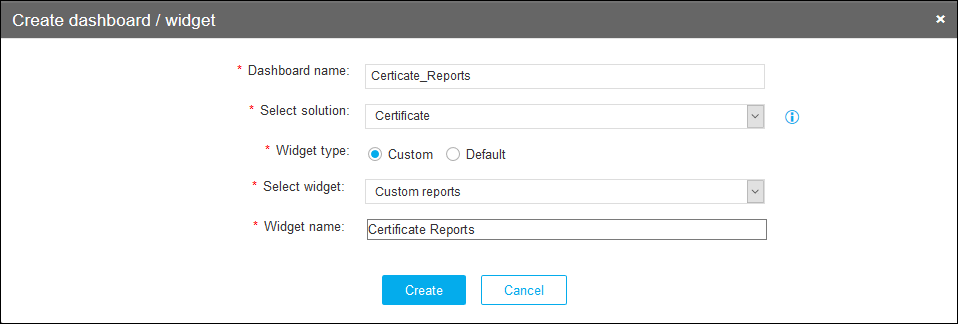
Table 1. Create Dashboard/Widget - Field and Description Table Field Description *Dashboard name Enter the name of the dashboard. *Select solution Select a solution from the Select Solution dropdown to which you want the widget to be created: ADC, Firewall, Certificate, SSH, or WAF. Select the solution from the dropdown to which you want the corresponding widgets to be managed: Certificate. *Widget type Select the Widget Type as follows: - Custom - Choose any one of
the below options from the Select
Widget dropdown:
- Application view – Allows you to group the service objects of a single application. The widget displays the health of these objects and the number of current connections that the services are receiving.
 Traffic statistics
– Displays a chart showing live and historic
performance statistics for individual device
objects.
Traffic statistics
– Displays a chart showing live and historic
performance statistics for individual device
objects.- Script execution –
Saves script files on a local machine and provides
easy access to maintain and execute script
commands from within the widget.
- Traffic grid –
Allows you to monitor and control the Traffic
Percentage of the Applications across data
centers. The status, state, and statistics for
applications can be viewed through this
widget.
- Class management –
Allows you to view and modify the classes
associated with iRules.
- HeatMap – Allows
you to view statistics for managed, failed, and
unresolved devices or device groups.
- Default - Choose the default widgets you want to manage/monitor in the custom dashboard. Select the default widgets you want to manage/monitor in the custom dashboard.
*Select widget - For Custom widget type,
Choose any one of the below options from the
Select Widget dropdown:
- Application view – Allows you to group the service objects of a single application. The widget displays the health of these objects and the number of current connections that the services are receiving.
- Traffic statistics
– Displays a chart showing live and historic
performance statistics for individual device
objects.
- Script execution –
Saves script files on a local machine and provides
easy access to maintain and execute script
commands from within the widget.
- Traffic grid –
Allows you to monitor and control the Traffic
Percentage of the Applications across data
centers. The status, state, and statistics for
applications can be viewed through this
widget.
- Class management –
Allows you to view and modify the classes
associated with iRules.
- HeatMap – Allows
you to view statistics for managed, failed, and
unresolved devices or device groups.
- For Default widget type, choose the default widgets you want to manage/monitor in the custom dashboard. Select the default widgets you want to manage/monitor in the custom dashboard.
*Widget name Enter a name for the new widget that you will be creating on the dashboard. *: Mandatory fields - Custom - Choose any one of
the below options from the Select
Widget dropdown:
-
Click Create.
You are redirected to the widget configuration screen, which varies according to the widget selected.Note:
-
The Settings screen for the new dashboard/widget appears. The contents of the Settings screen vary depending on the type of widget you are adding to your new dashboard.
-
All the default dashboards and custom dashboards created are listed in the dashboard inventory.
-
If the Auto Sort Dashboards Alphabetically is enabled the dashboards are listed in alphabetical order, if disabled dashboards are listed based on the created order.
-