Configure a Traffic Statistics Widget
To configure a Traffic statistics widget on your dashboard, complete the following steps:
-
If you are creating a Traffic statistics widget as part of creating a new dashboard,
complete the steps in the Create a Dashboard
topic above, then jump to Step 5 below. If you are creating a Traffic statistics widget
for an existing dashboard, click
 in the Command bar of the dashboard.
- On the Create widget screen that pops up, select Traffic statistics as the widget type.
- Enter a name for the widget.
- Click Create.
- On the Settings screen that appears, enter the time interval in minutes and seconds for collecting statistics from the devices.
- In the Live Interval field, set how often you want to collect the live performance statistics of an object.
- In the Vendor field, select the vendor whose devices you want to collect statistics for A10, AVI, Citrix, or F5.
- In the Device state field, select whether you want to include devices in the widget that have a status of Active, Standby, or All, where "All" means devices with a status of either Active or Standby.
-
In the Object type field, select the kind of object you are adding.
The options that appear in this field vary depending on the vendor you selected in Step 6.
-
In the Object field, select an object you want to gather statistics for.
The list of objects that appear varies depending on the object type you selected in Step 8.
-
In the Statistics field, enter the kind of statistics you want to gather.
The list of statistics varies depending on the object you selected in Step 9 and can include both live and historical data within the same widget.
- Click Add to add the object to the widget.
- Repeat steps 6-11 for each vendor, device, and object you want to include in the widget.
- When you are done
adding objects, click Save to create the widget.
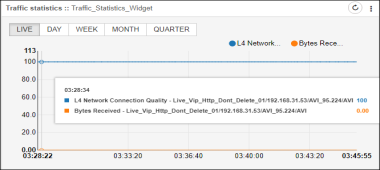
The dashboard screen reappears, displaying the widget (Live performance statistics) you just created.
- The historic performance statistics will be collected and displayed based on the
time interval you configured in the Settings > ADC >
Statistics. For detailed information, refer to the Statistics
Management section in theADC Settings
topic of this guide.
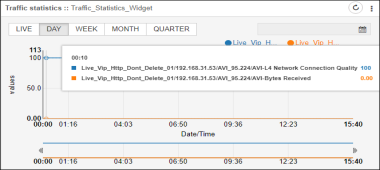
- Click on Day/Week/Month/Quarter tab within the widget to view the historic performance statistics.
- The historic performance statistics will be collected and displayed based on the
time interval you configured in the Settings > ADC >
Statistics. For detailed information, refer to the Statistics
Management section in theADC Settings
topic of this guide.