View AppVision Component Reports
To view the reports:
-
Click
 and select AppVision > Application.
The Application screen opens with the Inframap tab selected by default.
and select AppVision > Application.
The Application screen opens with the Inframap tab selected by default. - Open the application whose reports you want to view.
-
On the workspace that opens, click
 .
A bar chart made up of colored bars displays the total log, alert, configuration drift count, and requests corresponding to the timestamp.
.
A bar chart made up of colored bars displays the total log, alert, configuration drift count, and requests corresponding to the timestamp.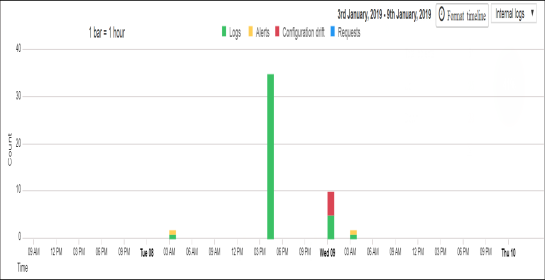
- Click on the legends (such as Logs, Alerts, Configuration drift, and Requests) to select/deselect the data that you want to be displayed/hid respectively on the chart.
-
Click on the particular bar in the chart to view the corresponding details.
Note: You cannot view the components reports for a Blueprint until it is deployed in an environment.
- Click on the Format timeline button to define the time for which you want to view the report.
- Click on the Internal logs dropdown and select the External logs option to view the logs generated from Splunk and ELK Stack.