Overview
The Dashboard enables you to manage, monitor, and interpret all configured applications and their
objects. Widgets on the dashboard display reports that provide consolidated statistics
of all accessible certificates, devices, and objects by extracting data from the
respective inventories and recording the key value indicators.
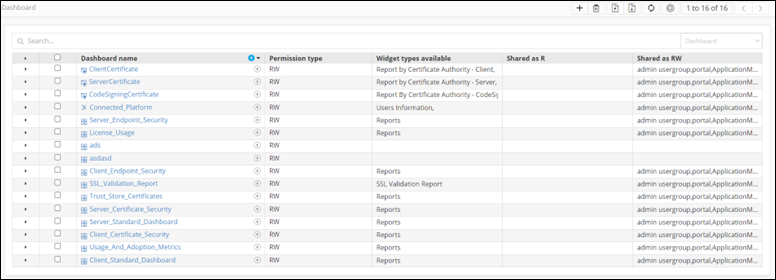
The following table describes the various options on the Dashboard inventory page:
- Default dashboards - Display predefined widgets to provide AppViewX metric usage reports and up-to-the-minute reports. It contains the status and statistics of devices and certificates managed within the AppViewX platform.
- Custom dashboards - Display widgets created by the user. Widgets and dashboards can be added, removed, or modified as necessary and can also be shared among multiple roles.
The following table describes the various options on the Dashboard inventory page:
| Options | Description |
|---|---|
| Search bar | Searches for the given keyword(s) in the field and shows a list of results that match the searched keyword(s). |
 |
Allows users to create a new dashboard. |
 |
Allows users to delete a dashboard from the list. |
 |
Allows users to export a dashboard from the list. |

|
Allows users to import a file to create a dashboard. |
 |
Refreshes the page by clicking on the refresh button. |
 |
Allows users to auto-sort the dashboards alphabetically. |